
| Number of Divisions | 9 | |||
| Number of Districts | 38 | |||
| Number of Sub-divisions | 101 | |||
| Number of C.D. Blocks | 534 | |||
| Number of Urban Agglomerations | 14 | |||
| Number of Towns | ||||
| - Statutory Towns | 139 | |||
| - Census Towns (Non-statutory) | 60 | |||
Number of Revenue Villages (including 21 part villages which falls in two C.D.Blocks) |
44,874 | |||
Population of Bihar |
10,38,04,637 |
|||
| Rate of increase in Population | 25.07% | |||
- Male |
5,41,85,347 |
|||
- Female |
4,96,19,290 |
|||
Population (0~6 Years Group) |
18,582,229 |
|||
- In Absolute Numbers |
1,85,82,229 |
|||
|
||||
|
||||
- Percentage of Total Population |
17.6% |
|||
|
||||
|
||||
Literacy in Bihar |
|
|||
- In Absolute Numbers |
5,43,90,254 |
|||
|
||||
|
||||
- Percentage of Total Population |
63.82% |
|||
|
||||
|
||||
Decadal Population Growth (2001-2011) |
|
|||
- Absolute |
2,09,25,841 |
|||
- As Percentage |
25.07% |
|||
Highest Decadal Growth at |
|
|||
Lowest Decadal Growth at |
|
|||
- Civil Police Stations |
813 |
|||
- Railway Police Stations |
40 |
|||
Density of Population |
1,102 per sq kms |
|||
- Highest Density |
1882 per sq kms in Sheohar |
|||
- Lowest Density |
488 per sq kms in Kaimur |
|||
Sex Ratio (Females/Thousand Males) |
916 |
|||
- Highest Ratio |
1015 in Gopalganj |
|||
- Lowest Ratio |
879 in Bhagalpur and Munger |
|||
Highest Literacy Rate in Bihar |
75.59% in Rohtas |
|||
| Lowest Literacy Rate in Bihar | 52.49% in Purnia | |||
| Highest Female Literacy Rate in Bihar | 65.53% in Munger | |||
| Lowest Female Literacy Rate in Bihar | 42.73% in Saharsa | |||
| Highest Male Literacy Rate in Bihar | 85.29% in Rohtas | |||
Lowest Male Literacy Rate in Bihar |
60.99% in Katihar |
|||
Average Population of a District |
27,31,701 |
|||
Population of Bihar |
8,28,78,796 |
|||
- Male |
4,31,53,964 |
|||
- Female |
3,97,24,832 |
|||
Population (0~6 Years Group) |
||||
- In Absolute Numbers |
1,62,34,539 |
|||
|
||||
|
||||
- Percentage of Total Population |
19.59% |
|||
|
||||
|
||||
Literacy in Bihar |
||||
- In Absolute Numbers |
3,16,75,607 |
|||
|
||||
|
||||
- Percentage of Total Population |
47.53% |
|||
|
||||
|
||||
Decadal Population Growth (1991-2001) |
130 |
|||
- Absolute |
1,83,48,242 |
|||
- As Percentage |
28.43% |
|||
Highest Decadal Growth at |
Sheohar District (36.16%) |
|||
Lowest Decadal Growth at |
Nalanda District (18.64%) |
|||
- Civil Police Stations |
813 |
|||
- Railway Police Stations |
40 |
|||
Density of Population |
880 per sq kms |
|||
- Highest Density |
Patna, 1471 per sq kms |
|||
- Lowest Density |
Kaimur, 382 per sq kms |
|||
Sex Ratio (Females/Thousand Males) |
921 |
|||
- Highest Ratio |
(Siwan) 1,033 |
|||
- Lowest Ratio |
(Patna) 873 |
|||
Highest Literacy Rate in Bihar |
Patna, 63.82% |
|||
Lowest Literacy Rate in Bihar |
Kishanganj, 31.02% |
|||
Average Population of a District |
22,39,967 |
|||
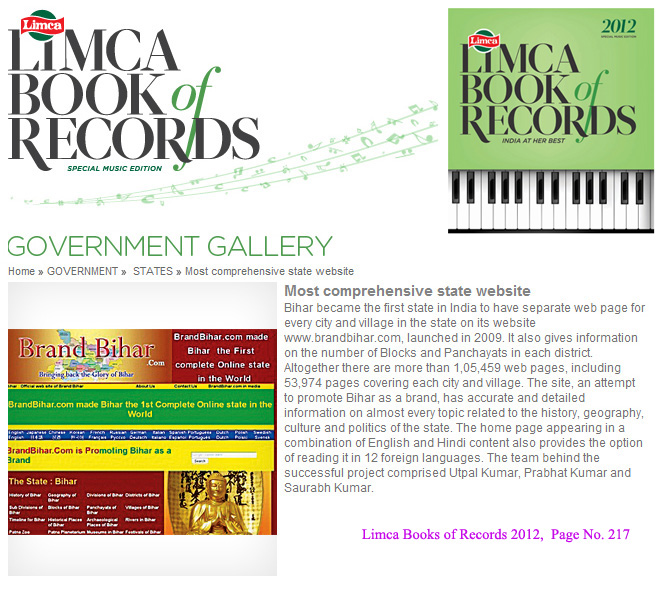
Bihar became the first state in India to have separate web page for every city and village in the state on its website www.brandbihar.com (Now www.brandbharat.com)
See the record in Limca Book of Records 2012 on Page No. 217